Parallel formula calculation in the spreadsheet
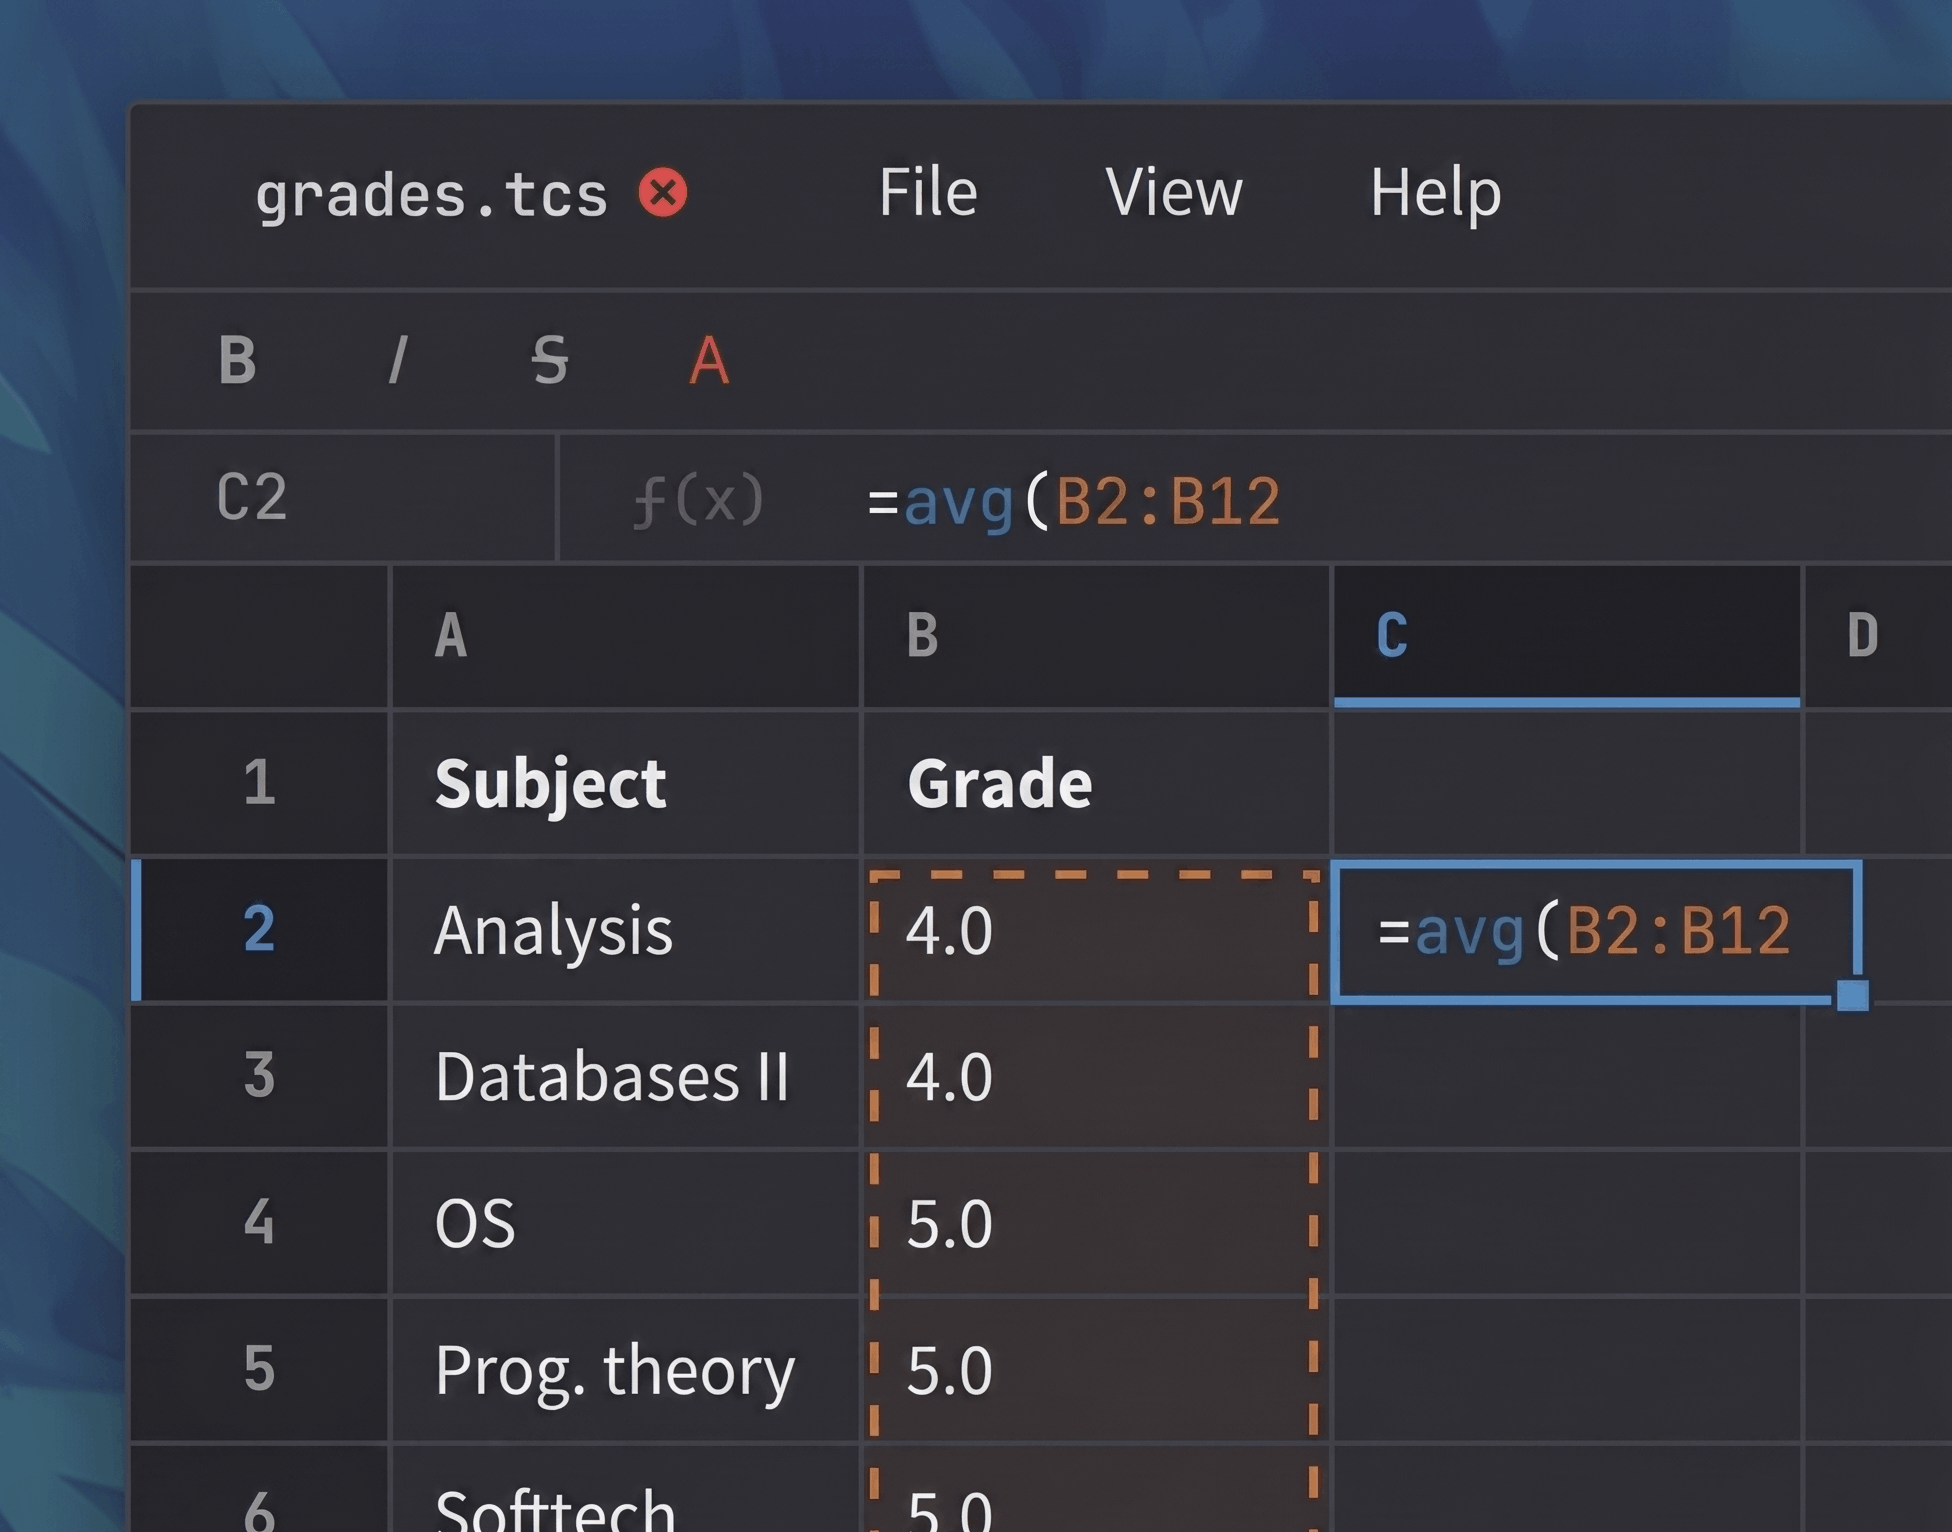
Screenshot of Tonic
I'm about to graduate, and this semester I was working on my thesis. I wanted it to be technically challenging and to have some production potential, so finding a topic was not easy. After thinking about it for a while, I decided to write a new spreadsheet application.
This idea came from a friend, who uses spreadsheets more than I do and suggested that existing spreadsheets can still be improved in many ways. My friend uses it for anything, from calculating a GPA to grading his students, which made me wonder why I was still reluctant to use spreadsheets myself. People across different professions, use these tools daily because they bring a lot of productivity.
I think I do not use spreadsheets as much partly because I just don't have the habit, and partly because existing solutions do not fit well with my workflow. I run Linux and prefer lightweight and local-first tools, open-source where possible. It is interesting to note that you do not need a spreadsheet in the same way you need Photoshop if you want to edit an image. Anything done in a spreadsheet can, in theory, be done manually too. And so, because of all the friction, I often end up using something else. When my friend used a spreadsheet to calculate the GPA, I used a simple calculator to get the same result. But when I needed to calculate GPA again for my new grades, I just asked my friend for his spreadsheet instead of bothering to type in the formula again.
The result is tonic, which I'm still working on in my free time. It uses Tauri, which lets write performance-sensitive parts in Rust, and UI in the web framework like Svelte. My goal was not to just replicate the basic functionality, but try to experiment and come up with new features.
It turns out that creating a spreadsheet is also a fairly complex technical task, I learned a lot while developing it. There are a lot of interconnected parts under the hood. I ended up writing a formula parser (using chumsky), a cache-efficient sparse grid representation, and a parallel formula calculation engine. A fast, pretty frontend is also almost as complex as the backend. And there is still a lot of work to do before tonic becomes production-ready. So I thought my experience might be useful for someone who also wants to build a better spreadsheet, or for someone who is just curious about how they work.
In this blog post, I want to talk about the algorithm that I used to calculate formulas in a spreadsheet. It's important to note that I'm still learning. If you find any mistakes, or just have some general advice, please contact me.
Spreadsheet calculation algorithm
A spreadsheet can contain formulas: mathematical expressions that reference values of other cells. When a user changes a cell, all formulas that reference it need to be recomputed. If their results change, the next formulas need to be recomputed too, and this chain continues until the whole spreadsheet is updated. This is pretty much the most important feature of the spreadsheet.
| A | B | C | |
|---|---|---|---|
| 1 | 10 | 20 =A1*2 | 120 =SUM(B1:B3) |
| 2 | 20 | 40 =A2*2 | |
| 3 | 30 | 60 =A3*2 |
The visualisation above shows the order in which formulas should be recomputed after different inputs. For example, if we change the value of A1 to 67, then B1 should be computed before C1. Otherwise, C1 will use the old value of B1, and the spreadsheet will display incorrect values. So we need a calculation algorithm that respects this order. We also want it to be as fast as possible, because almost all user actions trigger recalculation.
The first spreadsheet program, VisiCalc, used a straightforward algorithm. After any cell change, the whole spreadsheet is recalculated from top to bottom. But what about the order? The algorithm runs recalculations until the previous iteration produces the same values as the next one. In other words, until changed becomes false:
| A | B | C | |
|---|---|---|---|
| 1 | 10 | 20 =A1*2 | 120 =SUM(B1:B3) |
| 2 | 20 | 40 =A2*2 | |
| 3 | 30 | 60 =A3*2 |
changed:
                    false
This algorithm gives us an average time complexity of $O(n \cdot k)$, where $n$ is the size of the whole spreadsheet and $k$ is the number of times we had to run the recalculation. The worst case is quadratic, so the performance is not ideal. But the good side of this algorithm is its space complexity, which is just $O(n)$: we do not store any extra information besides the data itself. At that time, a program couldn't waste any RAM. The less memory a program used, the bigger spreadsheets it could create, which is why this algorithm was used in VisiCalc.
Today this algorithm may look inefficient, but users understood these limitations and structured their spreadsheets to avoid worst cases. If I had to guess, this habit is why we still create spreadsheets where formulas reference cells on the left-hand side of the grid, and summaries (like SUM or AVG) are placed at the bottom.
However, modern spreadsheets use more advanced algorithms, which preserve the relationships between cells, for example in the form of a DAG (directed acyclic graph). Each time a formula changes, we update the graph. During recalculation, we traverse it. In spreadsheets, this is usually called the "dependency graph", because it stores how formulas depend on other cells.
Consider some cells X and Y in the dependency graph.
Dependency graph
If cell X has a formula that references cell Y, then:
- Y is called the "dependency" of X
- X is called the "dependent" of Y
Likewise:
- All cells referenced by X are called "dependencies" of X
- All cells that reference Y are called the "dependents" of Y
The direction in the dependency graph is from a "dependency" to a "dependent". Remembering this will help you understand the visualisation of the algorithm. Maybe it's just me, but I often confuse which cell is which. You can see if you're me or not by guessing which cell is X in this case:
| A | B | C | |
|---|---|---|---|
| 1 | 10 | 20 =A1*2 | |
| 2 |
Correct, B1 is the dependent of A1, and A1 is the dependency of B1
Hello me!
The dependency graph lets us quickly find the dependencies and dependents of any cell. But there are two common implementations of a graph: adjacency list and adjacency matrix. Which one should we choose? A rough rule is to choose an adjacency list if the dependency graph is sparse (each node has a small number of edges), and an adjacency matrix if it is dense (each node has a lot of edges).
But the dependency graph in a spreadsheet is actually both. Some cells (like =A1*2) have only a single edge, while others (like =AVG(A1:A10000)) can have thousands of edges. This is why spreadsheets use different compression techniques (for example, instead of A1 -> B1, A2 -> B1, A3 -> B1, ..., A10000 -> B1, use just a single edge A1:A10000 -> B1). In my implementation, I decided to use the TACO algorithm to compress dependencies. In this post I want to focus on the formula calculation algorithm, so I won't go into further details. But I think the link will give you mcuh more details than I could, in case you are interested.
With the dependency graph, the new calculation algorithm recalculates only the cells affected by the user change. If the user changed A1, then we find the dependents of A1 and recalculate them, then recalculate their dependents, and so on. However, this is not enough, because it will not always respect formula order. For example, consider A1=5, B1=A1*2, C1=A1+B1. If we change A1, then we get its dependents: B1 and C1. We should first calculate B1 and only then C1, but a simple traversal (like BFS) does not guarantee this order.
One solution is to use Kahn's topological sort. Given a DAG, it returns a topological sort of the DAG such that for every edge u -> v, node u comes before v. It works by assigning an "in-degree" counter to each node in the graph. This counter represents how many edges point toward the node. For example, for the graph X -> Y, Z -> Y, Y -> A, the counters are as follows: in_degree(X) = 0, in_degree(Z) = 0, in_degree(Y) = 2, in_degree(A) = 1. Then, all nodes with an in-degree of 0 are added to a queue. We repeatedly remove a node from the queue, add it to our result list, and reduce the in-degree of all its adjacent nodes. If any of those nodes now have an in-degree of 0, they are added to the queue. This process continues until the queue is empty, and the result is a topological sort of the nodes. For us, this means that if we calculate the cells in this order, then the result should be correct.
In our case, the nodes are the cells in the dependency graph. The in-degree counter for cell X tells us how many dependencies we still need to calculate before calculating X. So, if the counter of X is 0, then all the dependencies of X are calculated and we can calculate X itself.
| A | B | C | |
|---|---|---|---|
| 1 | 10 | 20 =A1*2 | 60 =SUM(B1:B3) |
| 2 | 20 | 40 =A2*2 | 60 =A2+B2 |
| 3 |
First, we perform a regular BFS over the dependency graph to calculate the in-degree counters of each affected cell. When we visit a node, we increase the in-degree counter of each dependent.
Then we start the calculation. We add the updated cells that have an in-degree of 0 to the queue. Notice that updated cells can also have an in-degree greater than 0. We pop a cell from the queue, calculate it, and decrease the in-degree of each dependent by 1. If a dependent's in-degree becomes 0, we add it to the queue. We continue until the queue is empty.
The algorithm first performs BFS to update the in-degree counters, and then uses topological sort to calculate the formulas. Both steps have linear time complexity. So, the total time complexity is $O(V + E)$, where $V$ is the number of affected nodes and $E$ is the number of affected edges in the dependency graph. In the worst case, the affected subgraph is the whole dependency graph. However, most of the time, only a subgraph is affected. The cells are recalculated only when their inputs change, and each affected cell is calculated only once. This is much more efficient than the previous algorithm, where cells were repeatedly and redundantly recalculated.
Cycle detection
So far, I have not mentioned how cycles are detected in spreadsheets. A cycle happens when two formulas reference each other, for example A1=B1*2, B1=A1+100. Formulas with cycles will produce errors (unless iterative calculation is implemented). This is an important step in spreadsheet recalculation. It can sometimes take almost as much time as calculating formulas. I wasn't sure whether I should include it in the algorithm or not, and in the end decided not to. In my implementation, this is a separate step that happens afterward.
Lazy recalculation
In the next section, I will talk about making the algorithm faster by using more cores. There is also another optimization technique that can improve performance. I think I can call it "lazy recalculation": the idea is to calculate only the cells that are displayed on the screen. It is partially used in Google Sheets, which prioritizes visible formulas. But, as far as I know, Excel does not use it because of data integrity concerns.
Making this parallel
I wanted to go further and make this algorithm parallel, mostly for fun. It was also a good opportunity to practice concurrency in Rust.
I think a good parallel strategy is one that needs little to no synchronization between threads. For this Kahn-based algorithm, the main change is to use an atomic integer, instead of a regular integer, for the in-degree counter. When a thread starts calculating cell X with an in-degree of zero, all dependencies of X are already calculated, so the thread can read them safely (no other thread will write to them). When a thread finishes calculating a cell, it decreases the in-degree of its dependents (safe because it is an atomic integer). If a dependent's in-degree becomes 0 after this, then the cell that was just calculated was its last dependency, so only that thread schedules it.
The last observation is the main reason a thread can safely write to the cell it started calculating. No other thread calculates it, and no other thread will read from it before the topological order allows it.
A simple first idea is to start X threads and give each one its own portion of cells, instead of putting updated cells into one queue as before. But we do not know how much time each formula will take. One thread may calculate B1 quickly and then stop because B1 does not have any dependents, while another thread calculates C1 and then starts calculating thousands of its dependents. A good parallel strategy should use all cores as much as possible, so we need to introduce some load balancing.
There's another problem that requires load balancing as well. So far, we have talked about calculating multiple formulas in parallel, but we might also want to improve performance by calculating a single formula in parallel. For example, =AVG(A1:A1000000) and similar formulas can benefit from this. Not every spreadsheet would need this, but I decided to include it just for fun.
I will describe my attempt to implement the algorithm while keeping the load-balancing problem in mind. I'm sure there exist better approaches, writing good concurrent code requires much more experience than I have.
Async in Rust is a useful abstraction for simplifying concurrent code. It gives us a "task": a piece of code that can be paused and continued. This is very useful in a high-throughput web server, for example. When a user request (task A) causes a web server to send a database request, the web server can pause task A instead of waiting, and continue working on other tasks (serving other users). When the response arrives, task A continues. As you can see, this is useful even on a single thread.
However, in Rust, async is only an abstraction. To get the actual implementation, you need an external library: a "runtime". Its job is to manage tasks. Runtimes try to process many tasks quickly, and many of them use parallelism. In that case, they also need load-balancing strategies, because tasks can take a long or short time to finish, just like formulas in our case. The most popular runtime, tokio, uses an advanced work-stealing scheduler (when a thread has nothing to do, it "steals" work from other threads).
I think there is a neat similarity between formulas and tasks. So I thought: why not create a task for each formula, and let the Rust async runtime handle the load balancing?
Note on the runtime selection and overhead
One task per formula calculation has a lot of overhead. Each task is usually allocated on the heap so it can be sent to another thread (if balancing is needed). I started with the tokio runtime, but then switched to forte, which performed better in my experiments. Even then, I ended up creating tasks for multiple formulas (one task per 1000 formulas) to reduce overhead, which made the code a bit more complex. See the "Benchmarking" note for exact numbers.
Conceptually, the algorithm becomes as follows: spawn a new task for each formula. When task A finishes calculating its formula, it spawns new tasks for its dependents. Inside a formula, if some function can be parallelised (like SUM), we spawn helper tasks and then combine their results (fork & join). After that, task A resumes as usual.
| A | B | C | |
|---|---|---|---|
| 1 | 10 | 20 =A1*2 | 60 =SUM(B1:B3) |
| 2 | 20 | 40 =A2*2 | 60 =A2+B2 |
| 3 |
*async runtime is assigning the tasks to threads
The result is around 4x faster than the synchronous algorithm. I hope the visualisation does not oversimplify what happens in the code.
Thank you for reading! I hoped you enjoyed and learned something new :)
Benchmarking
To get the 4x number, I created a test spreadsheet file. It contains 10M values, 1M formulas (which reference values on the left), and a single =SUM(A1:J1000000) formula. The test file is stored inside the repository: tonic/tauri-backend/test-files.
You can reproduce this in release mode by comparing the sync version (git checkout 82c7874e20ea0c4fa24d62b021daaace854989df) against the parallel version (git checkout 11dd9ec68dbe6e2d75a11eac7fad7133195006a6). Or, alternatively, run cargo bench.
On my machine:
- CPU: AMD Ryzen 9 3900X 12-Core Processor
- Cores: 12 physical cores / 24 threads
- RAM: 64 GB
I get these results (excluding cycle detection and counter init):
| calculation | sync | parallel | speedup |
|---|---|---|---|
calculate L3 (=SUM(A1:J1000000)) | 179.47ms | 43.75ms | 4.1x |
calculate K1:K1000000 (=H1+I1+J1) | 287.90ms | 56.78ms | 5.1x |
| calculate L3 and K1:K1000000 | 460.20ms | 114.15ms | 4.0x |